
Re-designing an Employee wellbeing platform
Responsibilities
UI design
Deliverables
Hi-Fidelity Figma Design
Overview
Who is the User?
The ideal Qimi end user is typically a small to mid-size organization in industries like technology, startups, consulting, and healthcare , as well as various others. These companies prioritize employee development, performance management, and engagement. Key individual users include HR professionals, team leaders, people managers, CEOs, and individual contributors who seek a platform to streamline HR processes, foster growth, and improve performance.
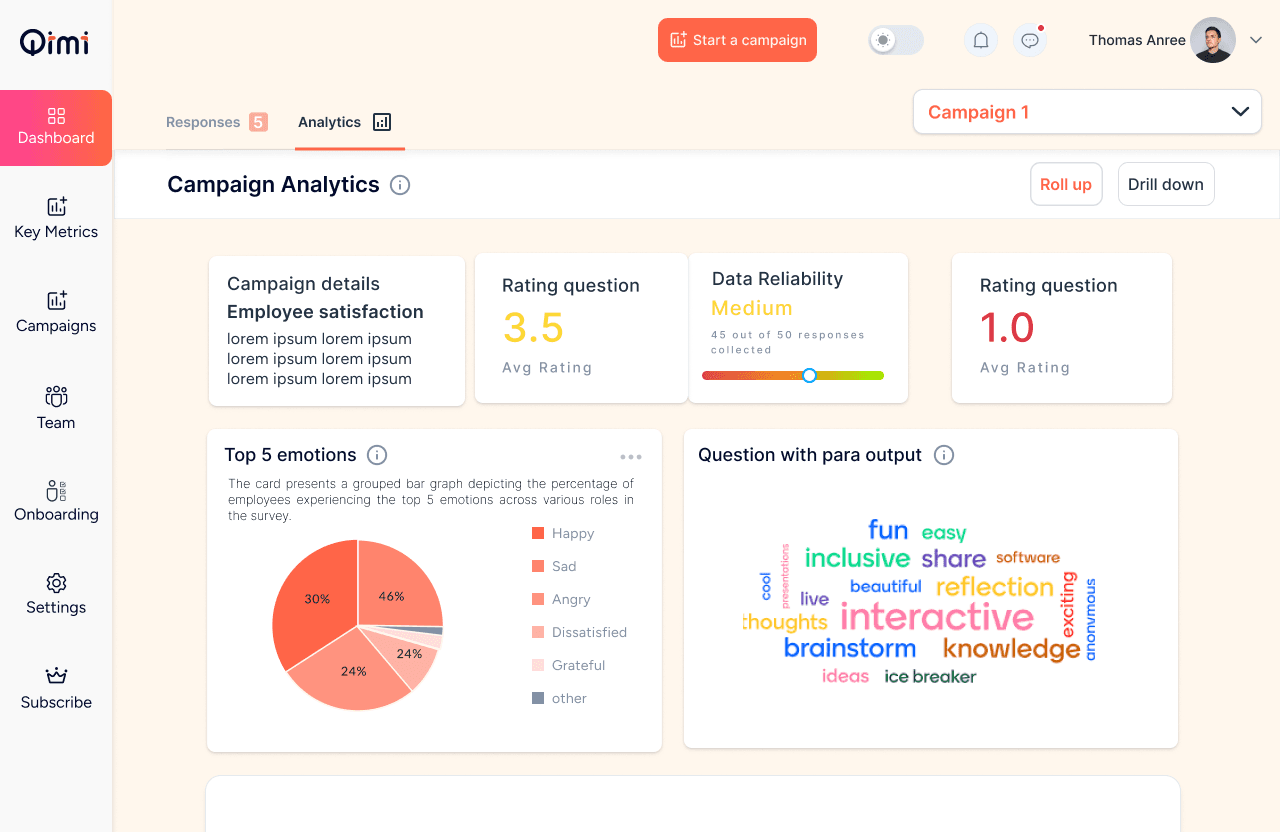
Where the Original Design Fell Short
Information Overload and Visual Clutter
The dashboard packs a lot of information into a relatively small space. The multiple cards, graphs, and text elements might feel overwhelming and visually noisy.
Inconsistent Visual Hierarchy
The prominence of different elements seems inconsistent. For example, the "Campaign details" text has the same visual weight as the "Rating question" values, which might not be the intended hierarchy
Inconsistent Card Styling
While subtle, there are slight inconsistencies in the styling of the cards (e.g., the placement and styling of the titles and information icons)
Navigation
While not directly visible in this view, the left-hand navigation labels ("Responses," "Analytics") as tabs within the "Campaign Analytics" section might suggest a potentially complex information architecture. Users might need to click through multiple levels to find specific data.
Final Shipped Design


#1 Dashboard
Designed a clean and intuitive user interface with a focus on readability and visual hierarchy.
Reduced cognitive load by presenting only essential information.
Incorporated a personalized welcome message and relevant notifications to create a more engaging user experience.
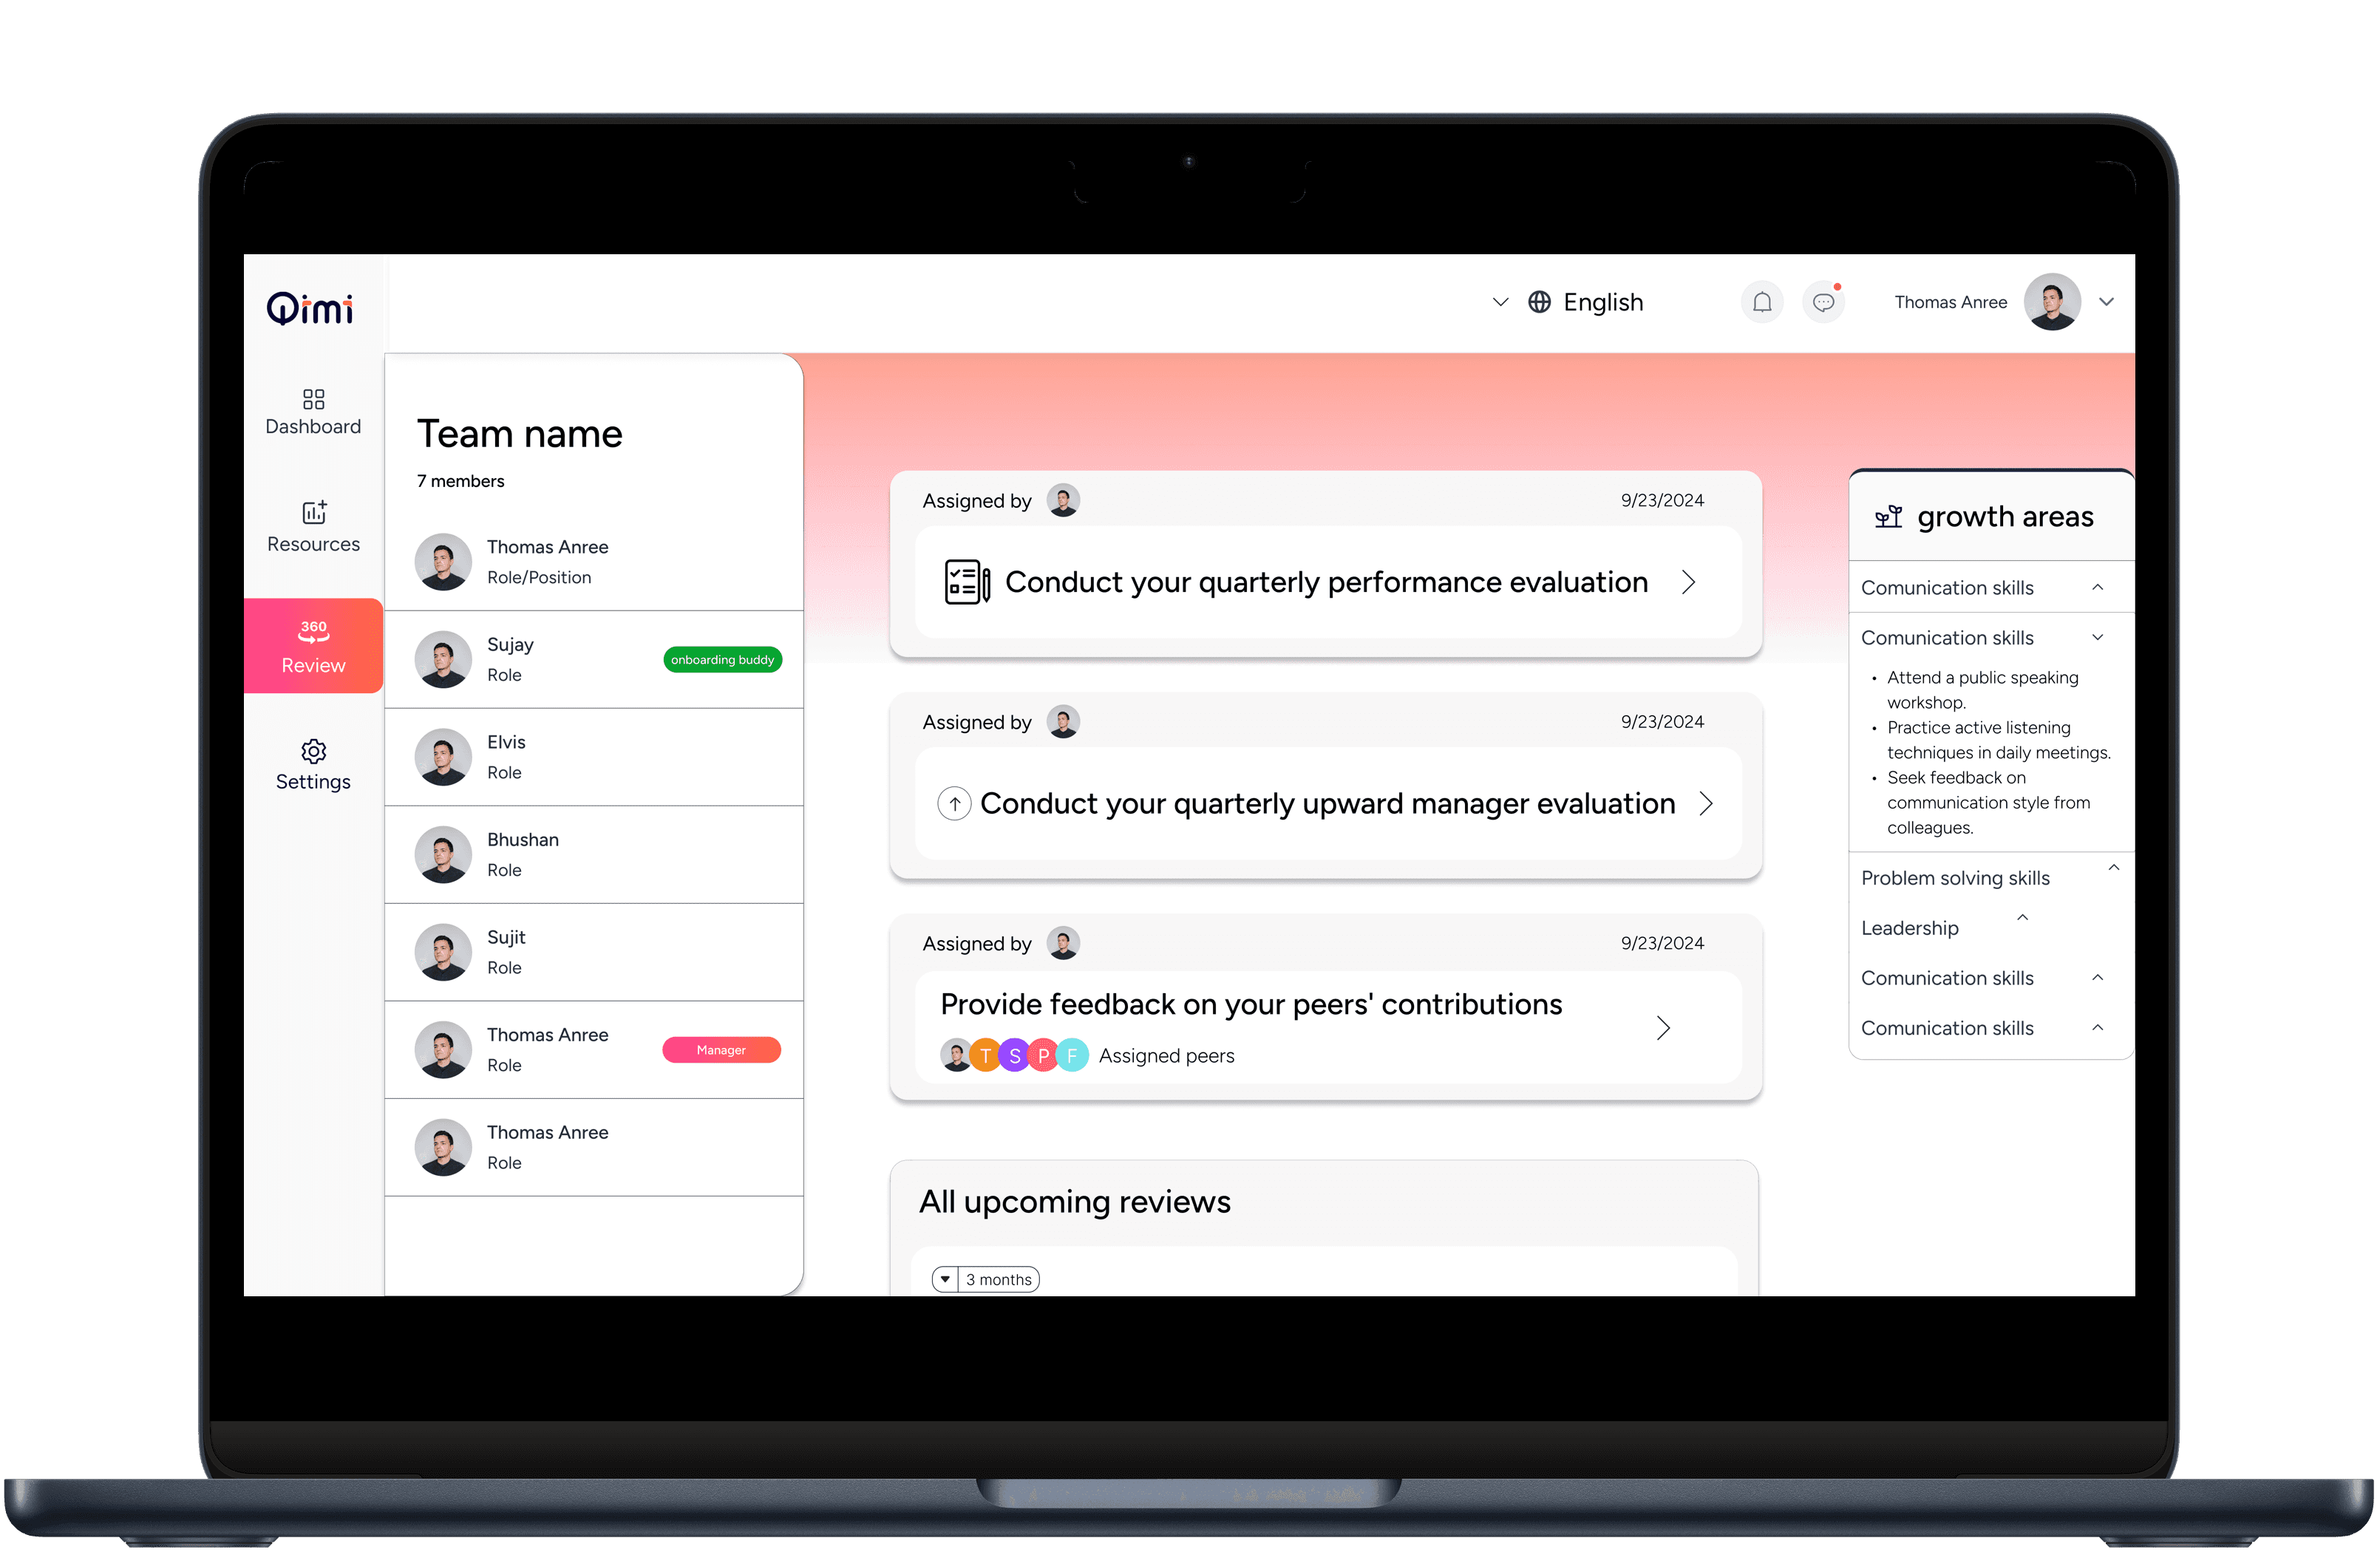
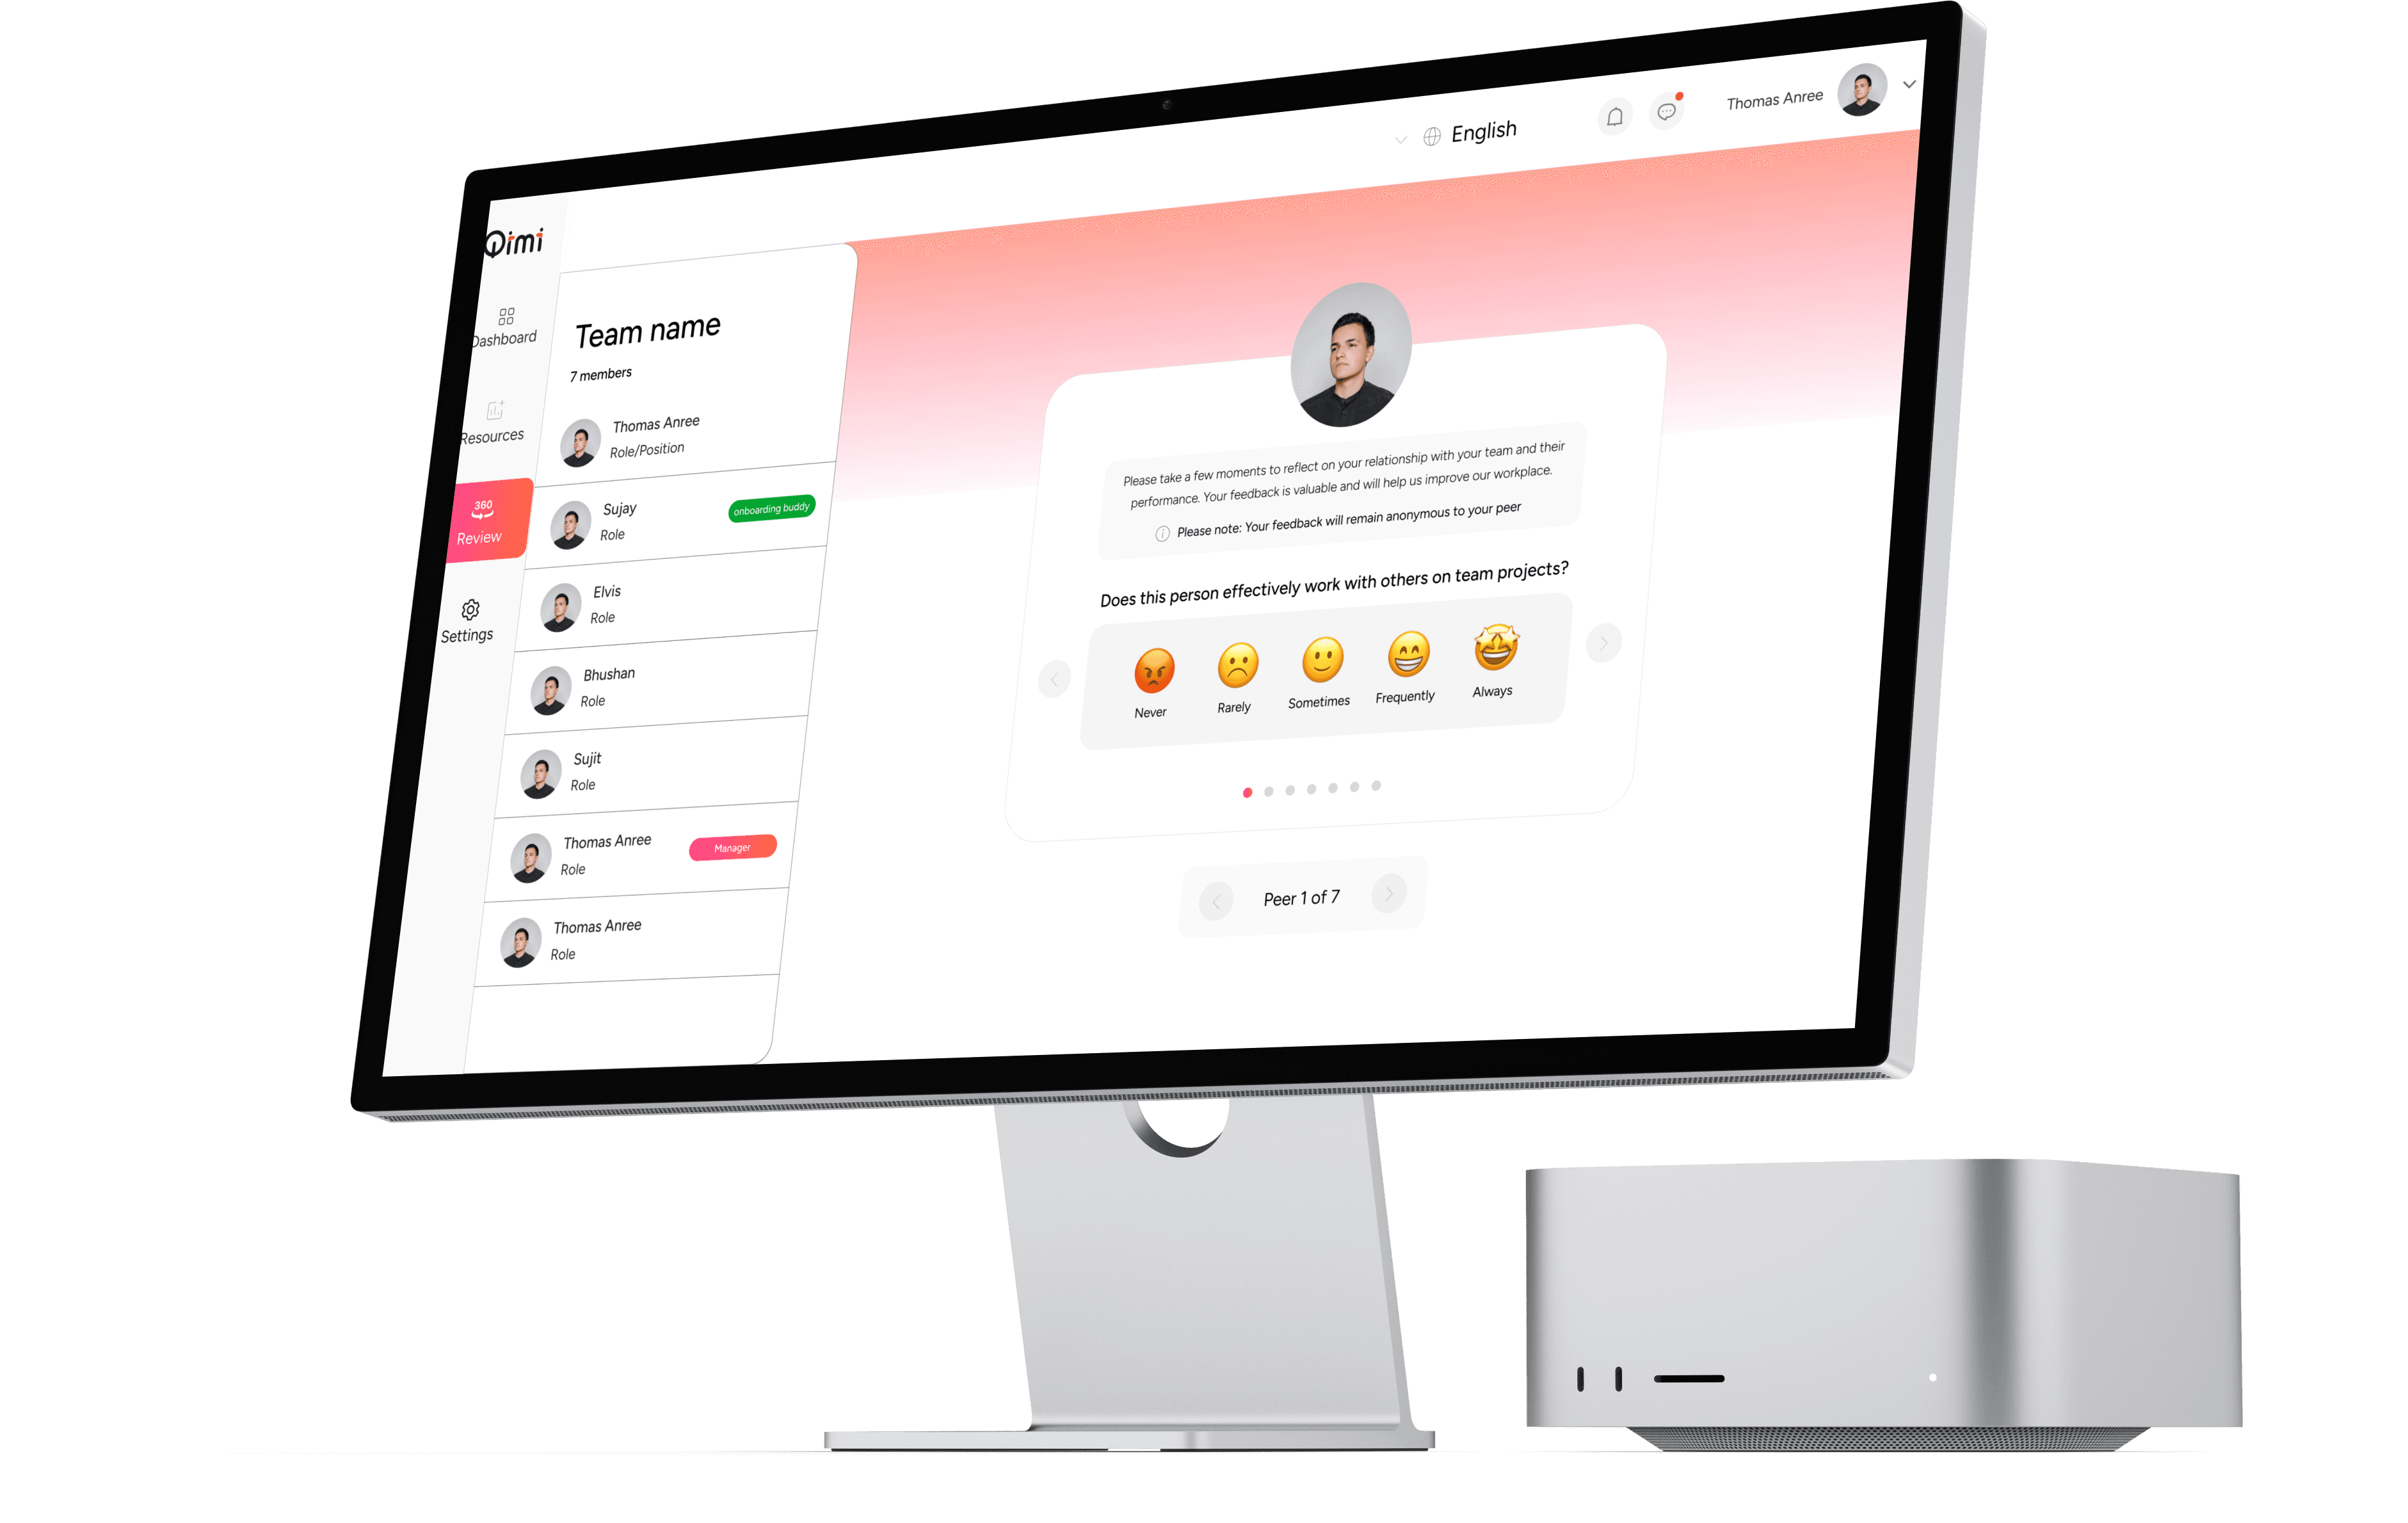
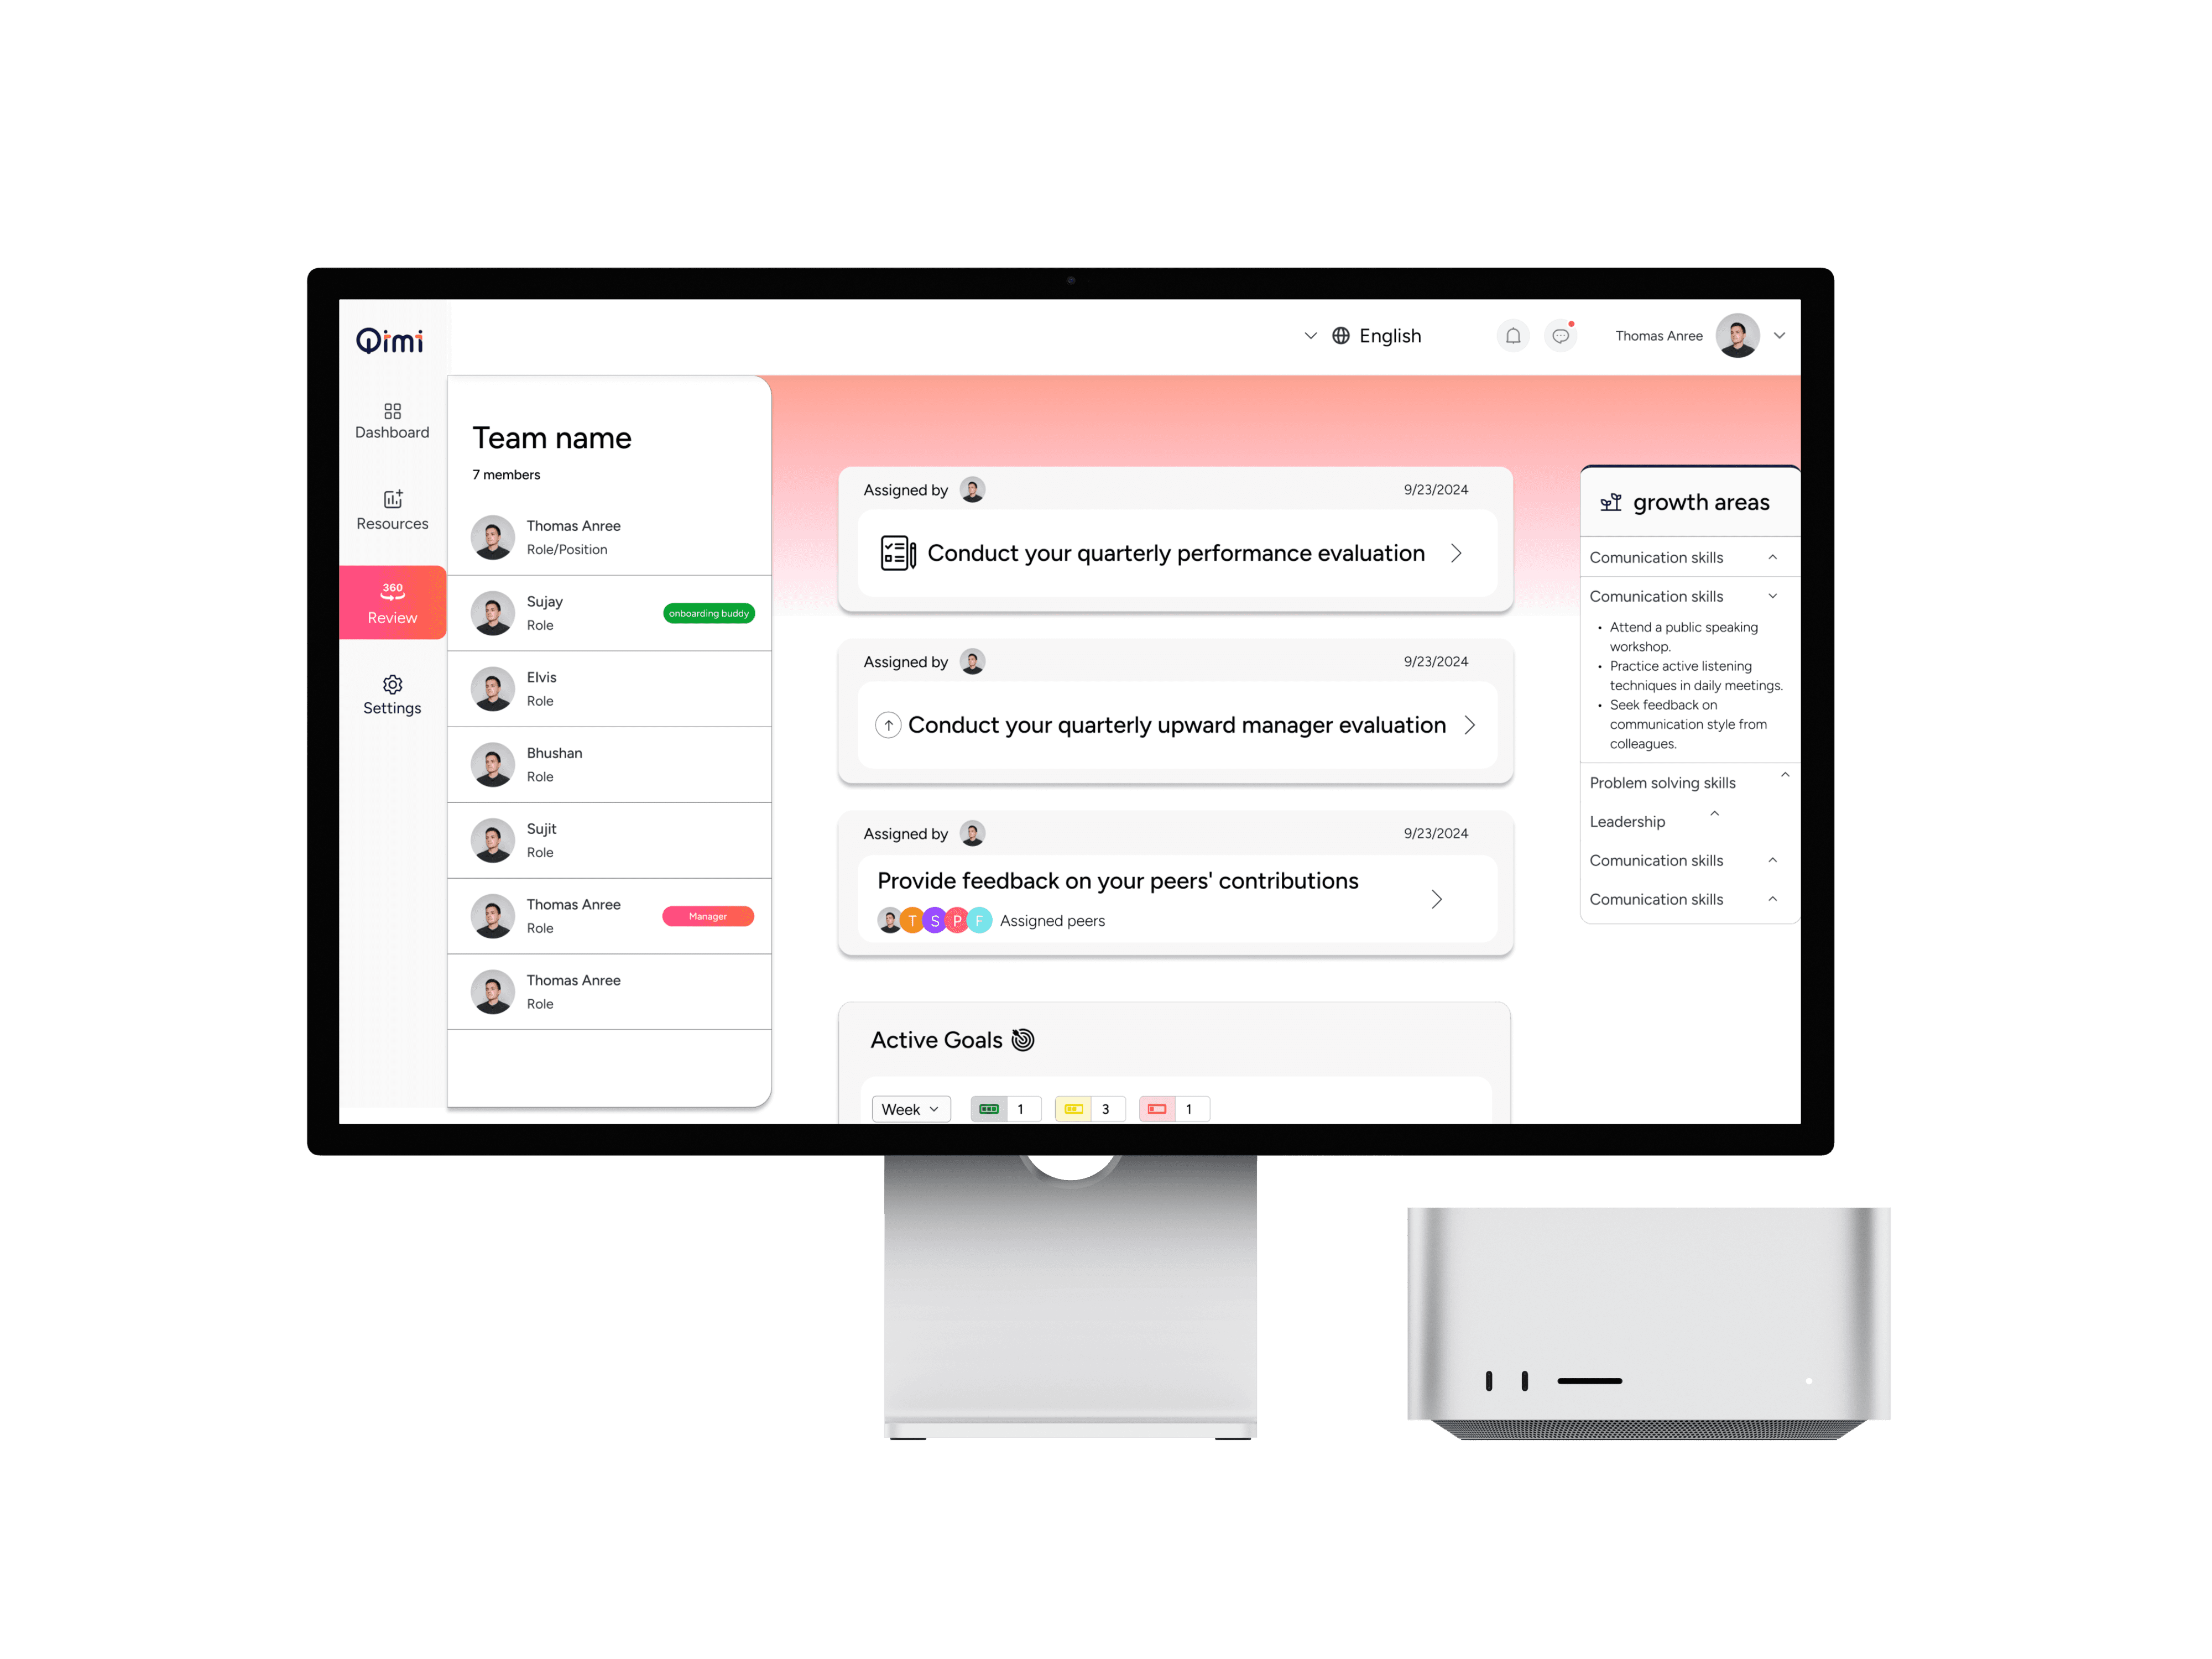
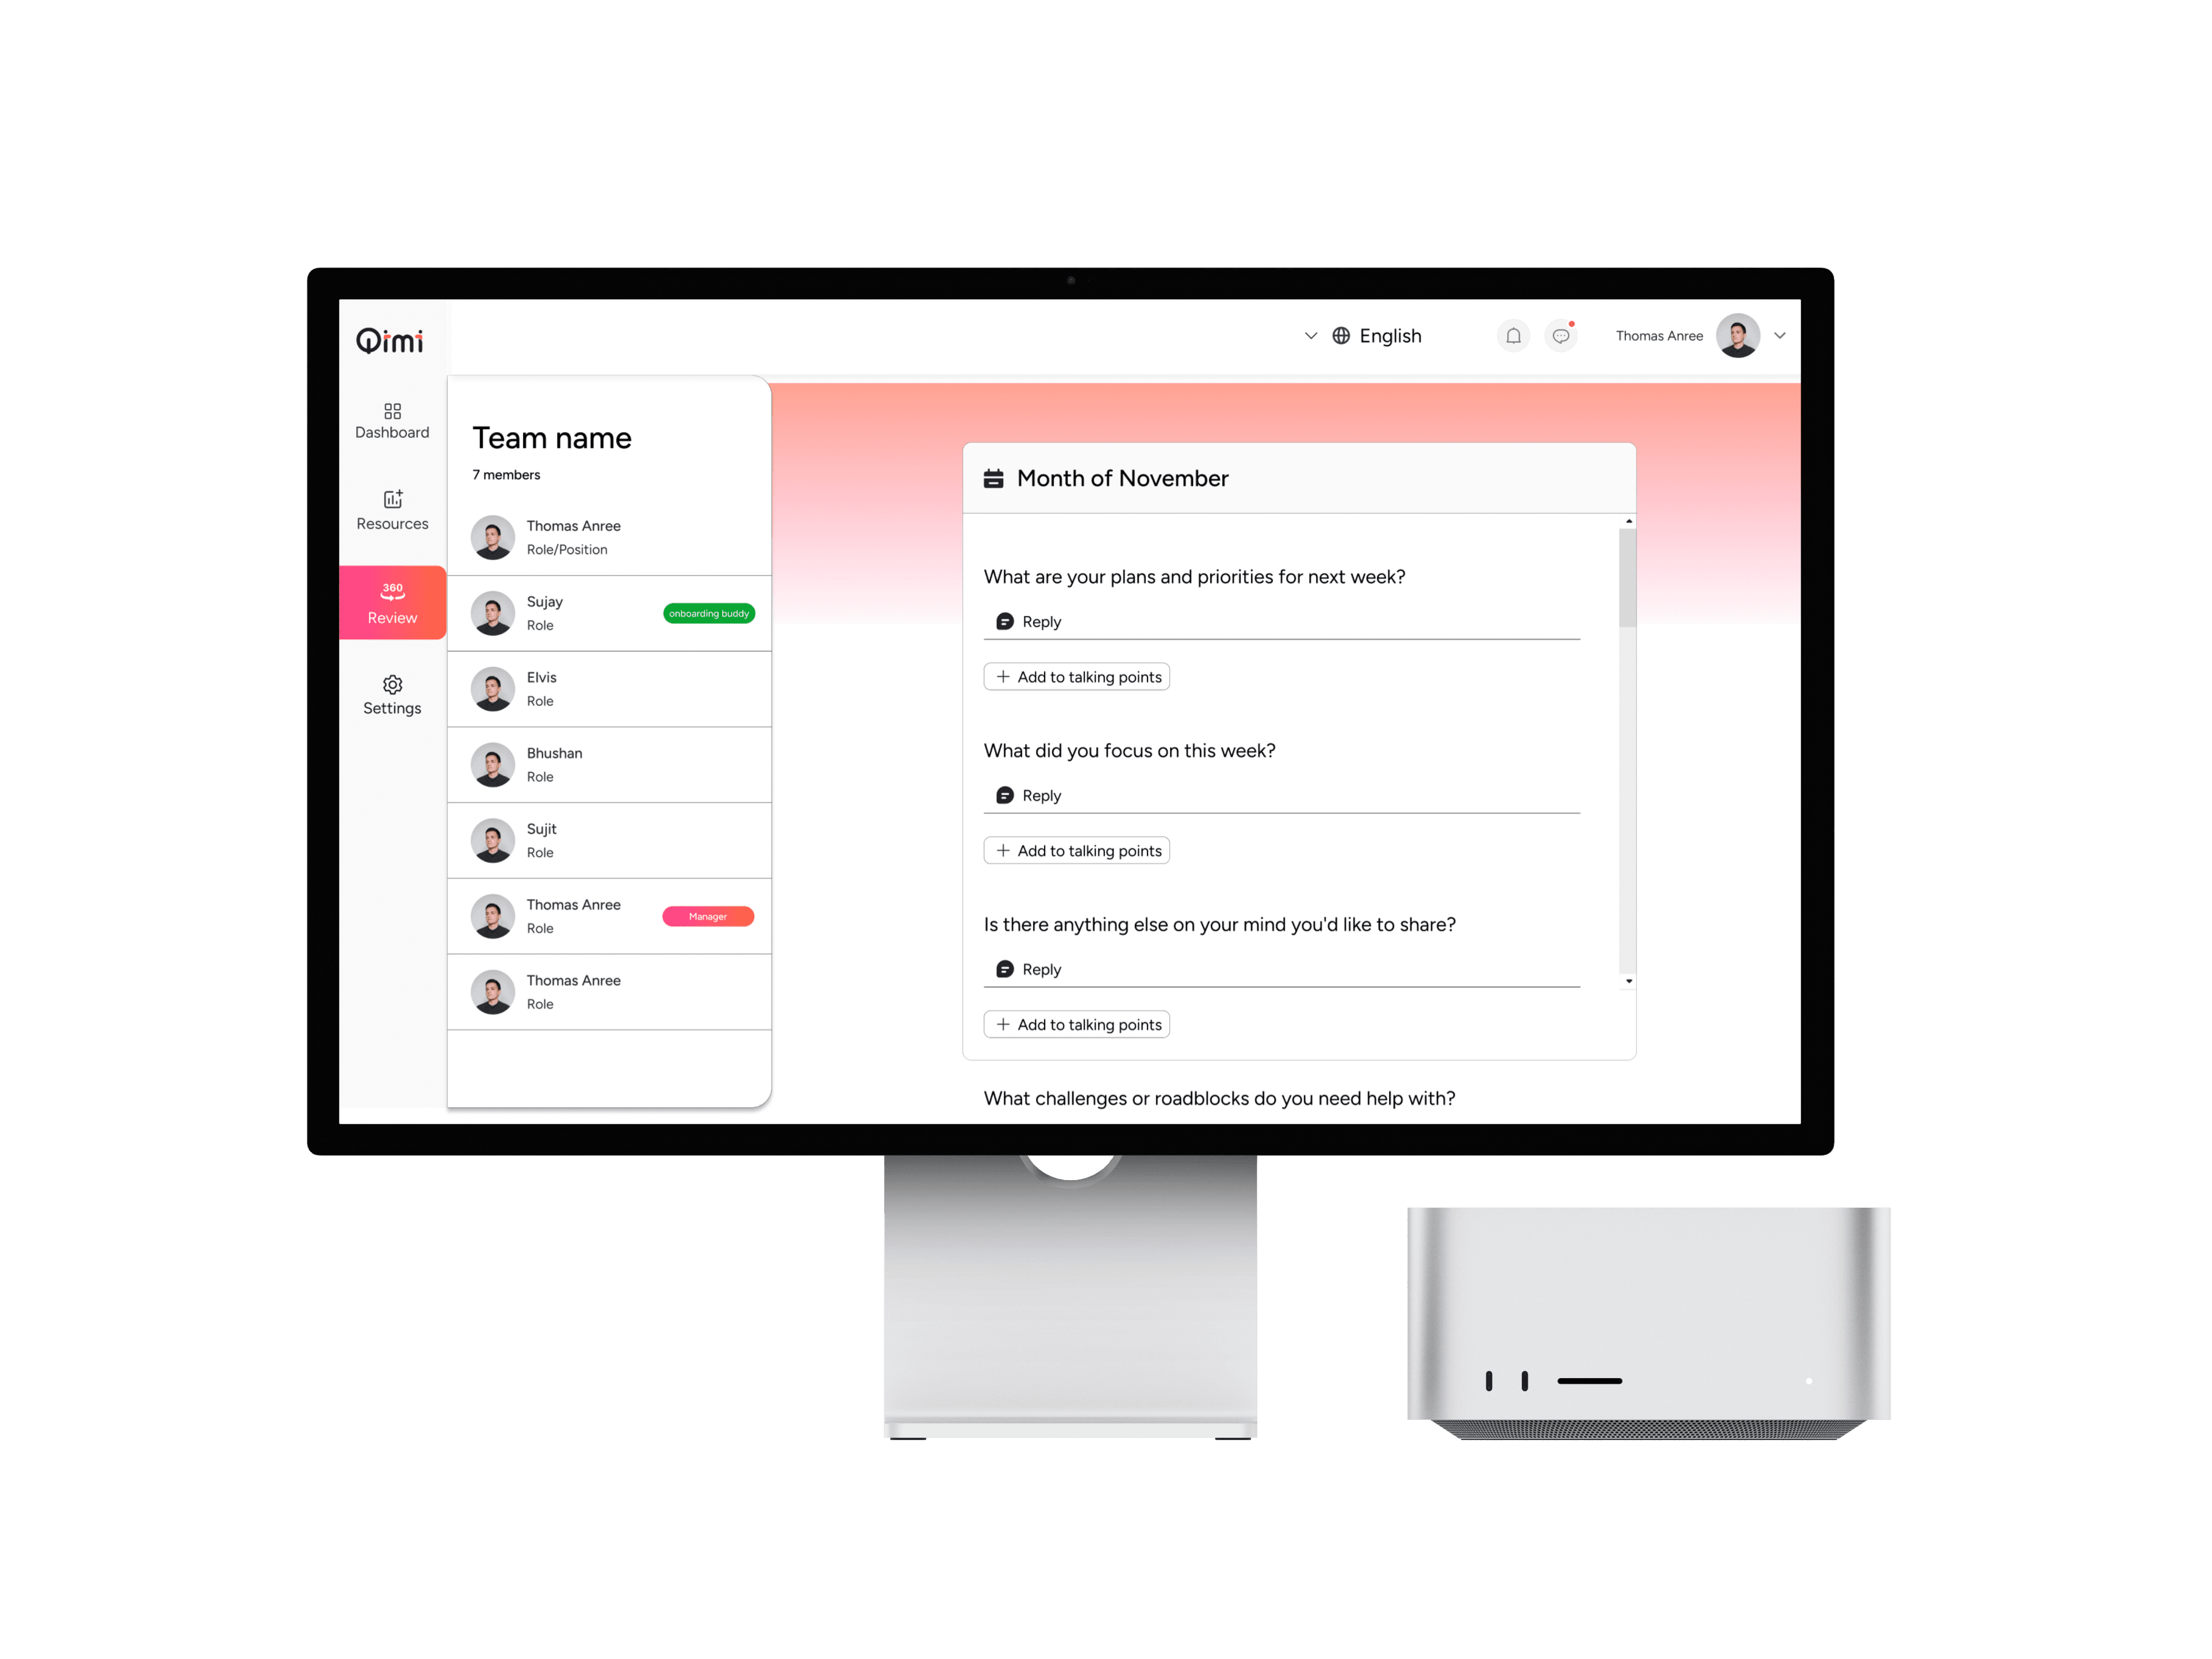
#2 360 Review
Simplifying the performance review process for all stakeholders
Performance reviews incorporating peer feedback, regular check-ins, and upward manager evaluations.
Goal tracking and reporting, along with features for upcoming reviews and growth areas, help users improve for their next review.
Anonymous upward and peer reviews
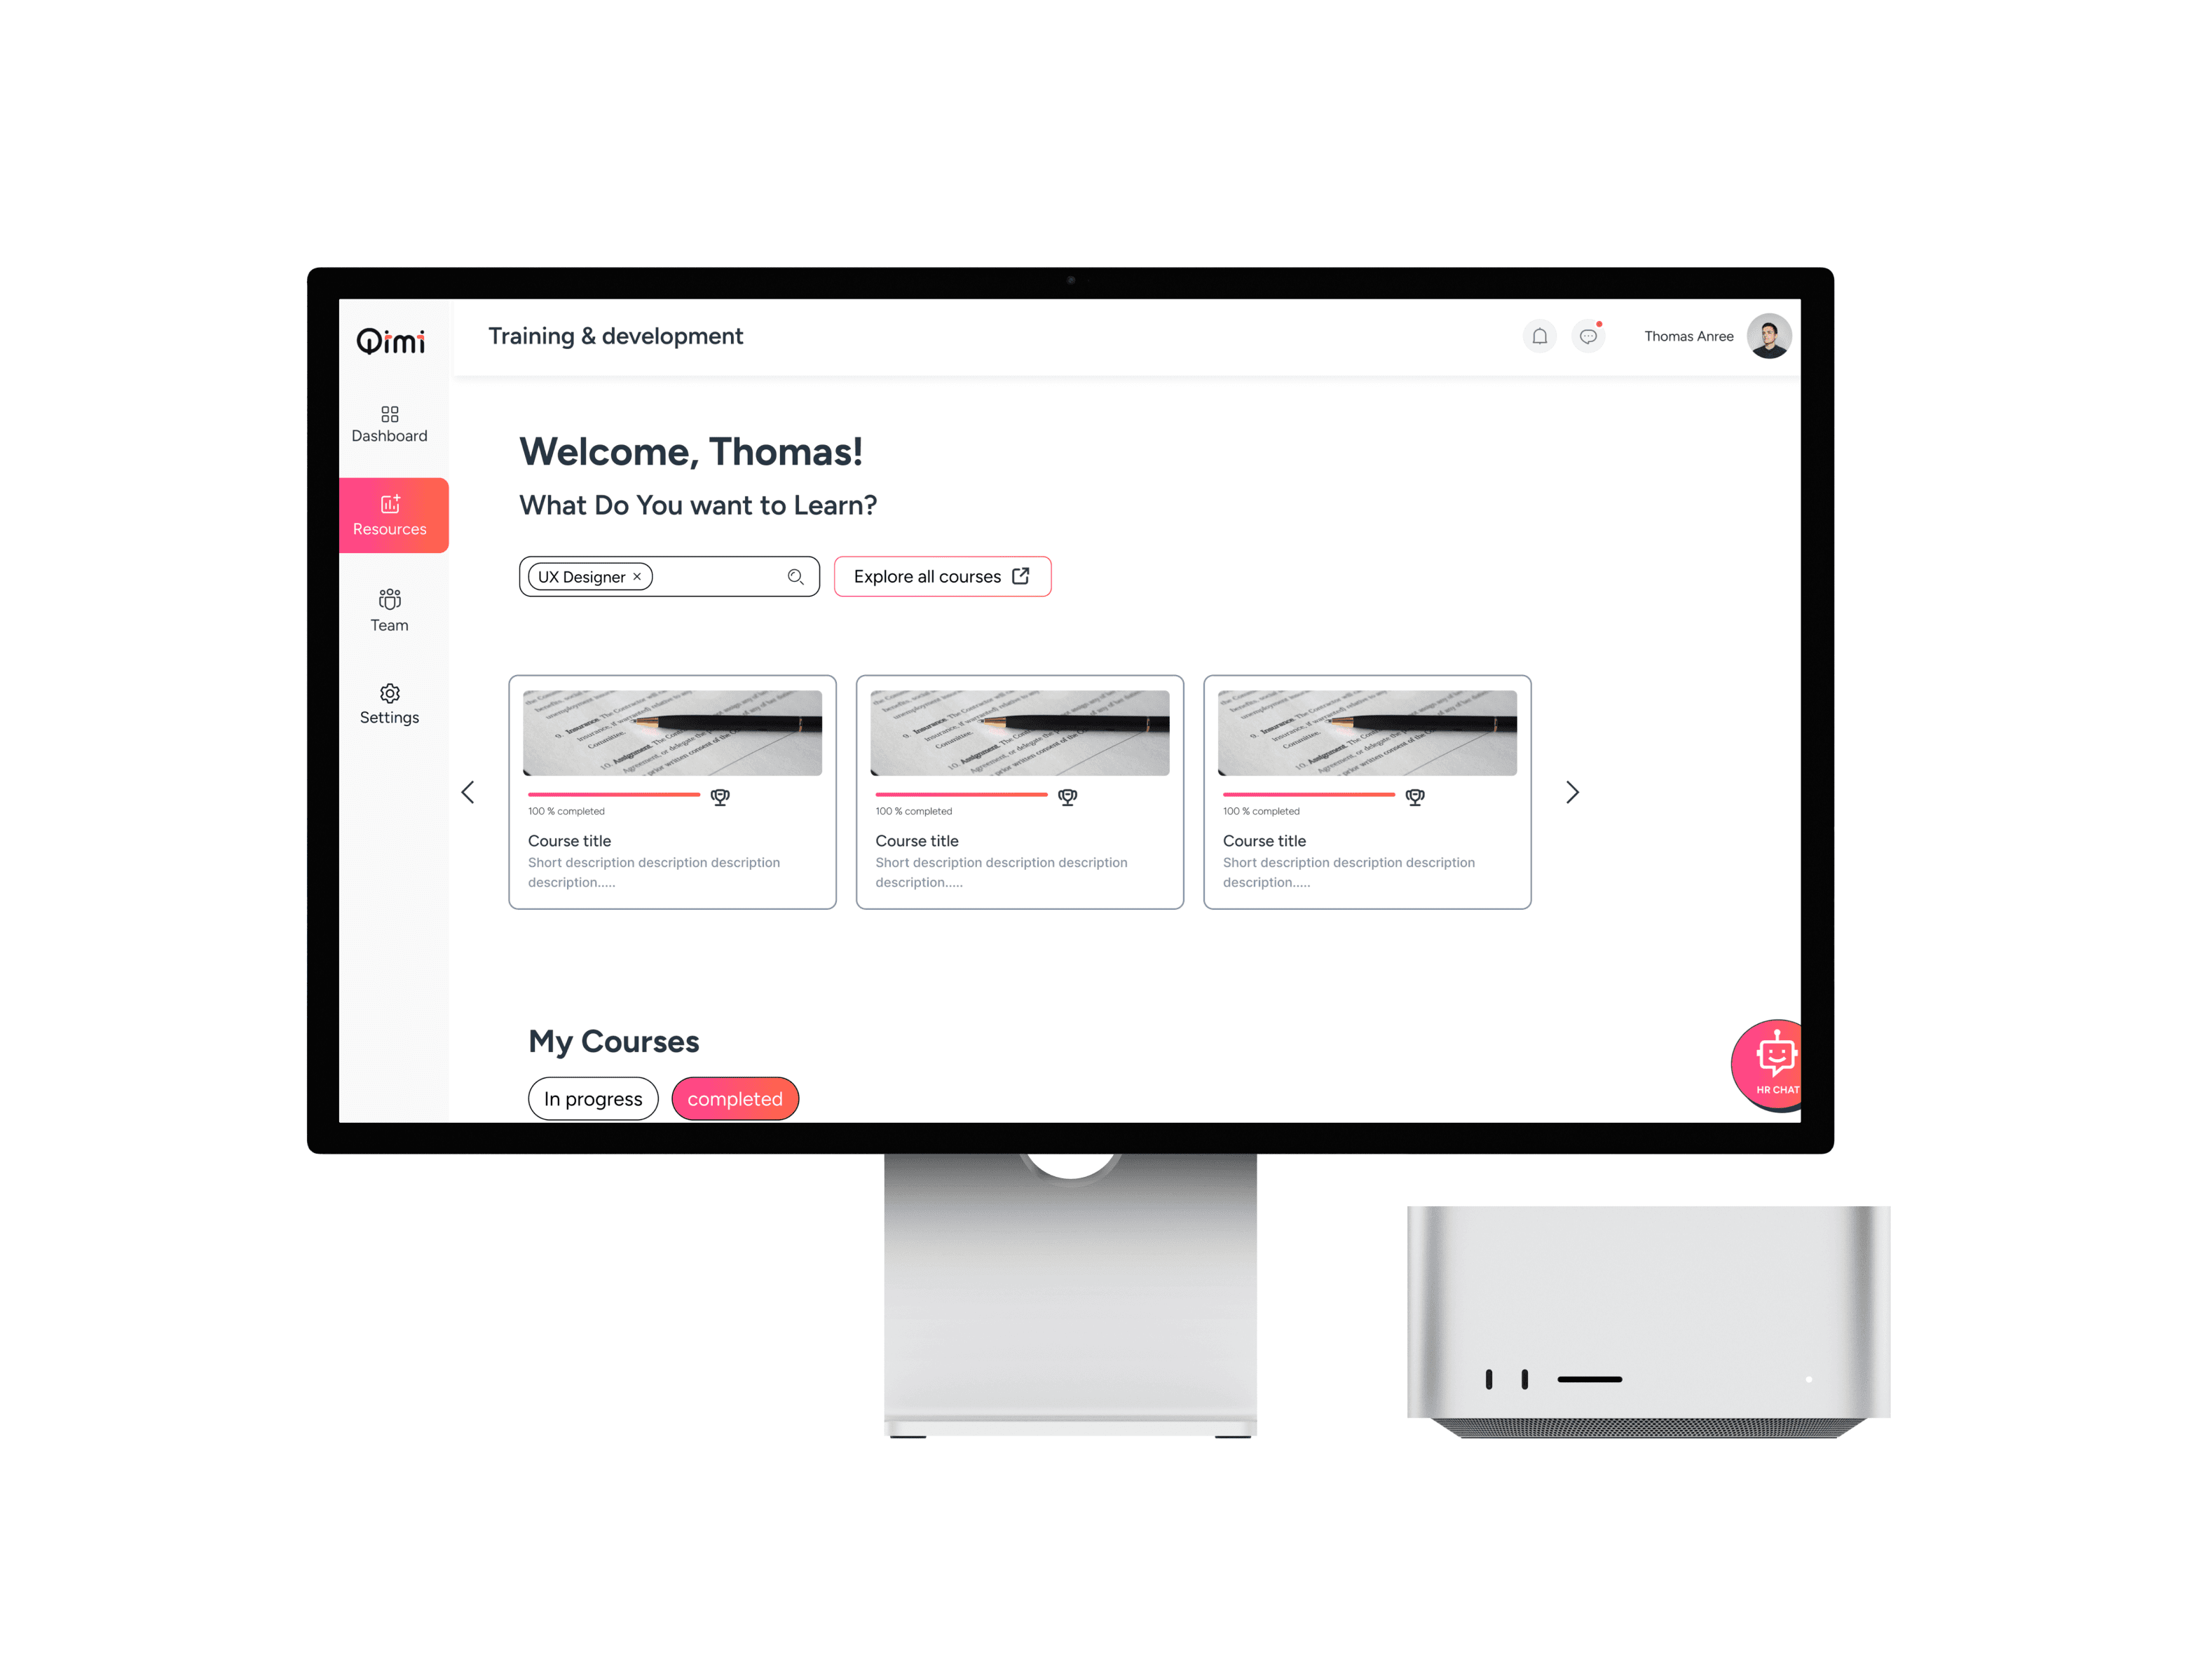


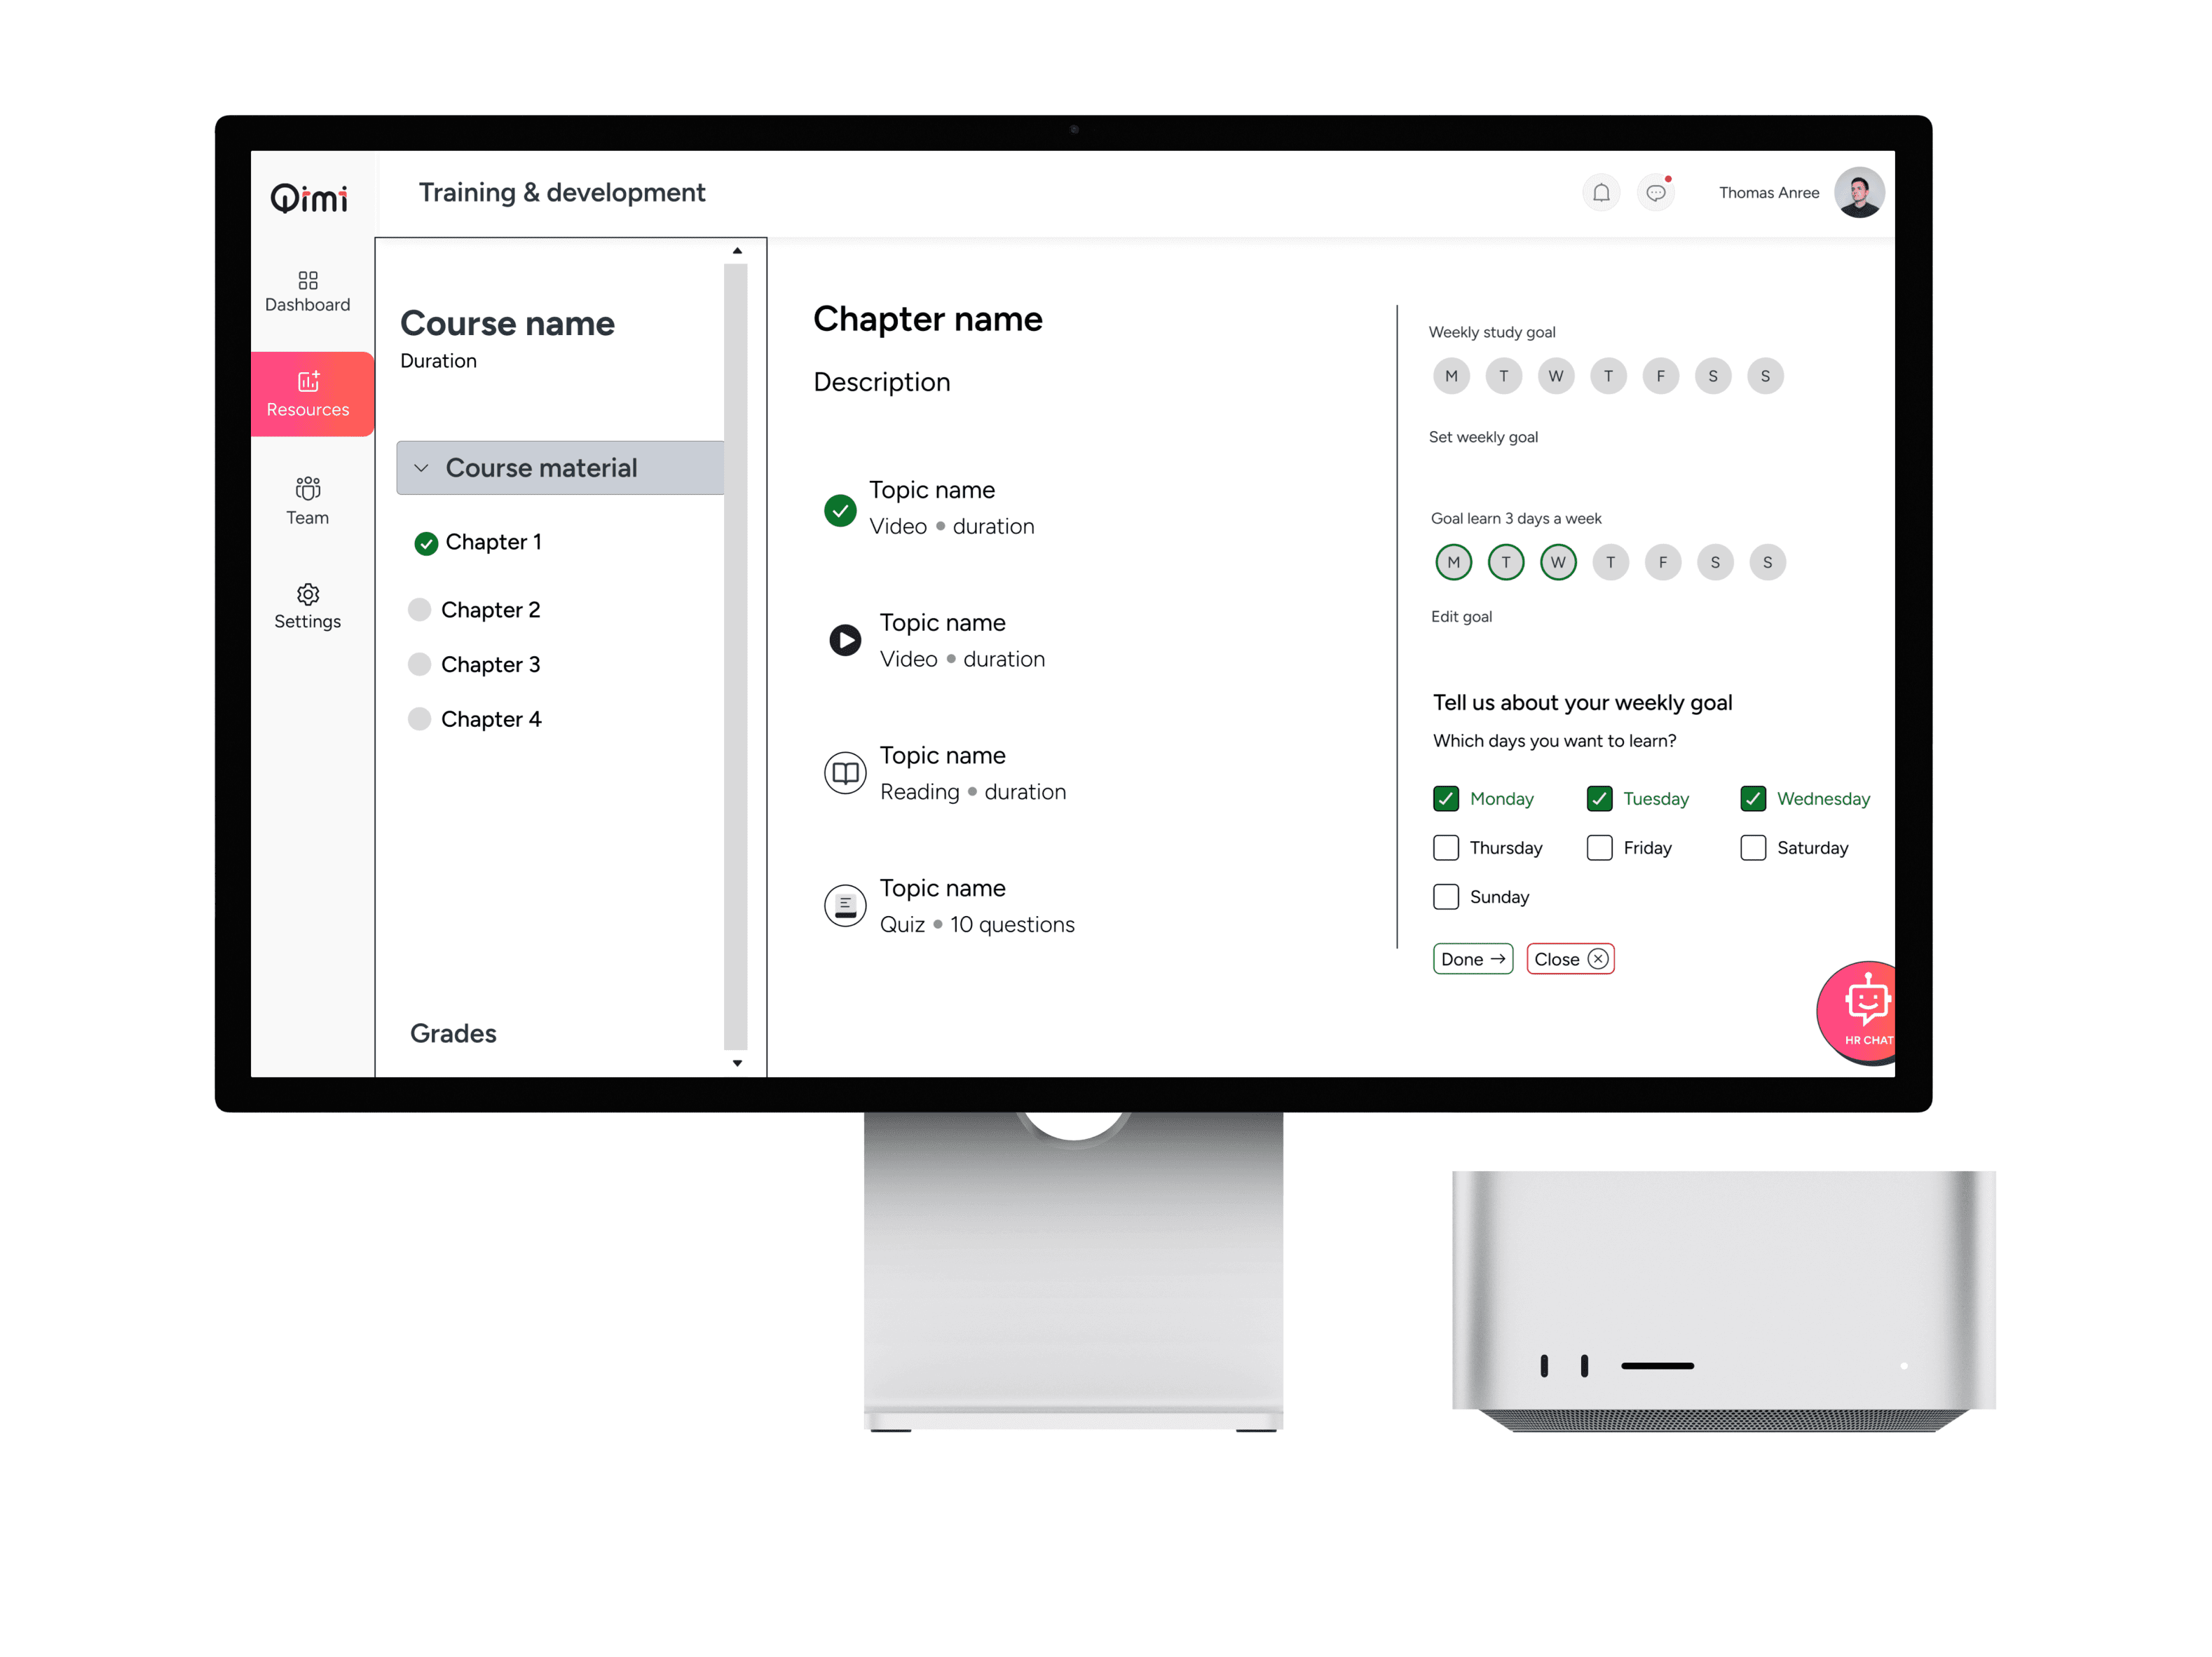
#3 Resources
An organizational Learning & Development portal for upskilling employees
Provides a centralized platform for new employees to explore company resources.
Progress-tracking assessments to reinforce learning
Interactive discussion boards for knowledge sharing
Tailored course suggestions based on job roles
Conclusion
All-in-all a delightful, fast-paced project. The client was very happy with the look & feel, and I am looking forward to how it performs once live.
copyright
Sujay Noronha
sujaynoronha@gmail.com